Introduction
In many gas phase applications different polar vapors have to be removed from a given gas mixture. Especially for waste air treatment, the presence of water can disturb the sorption of some harmful components. For this purpose activated carbons with nonpolar surface properties are widely used. However, in waste air applications the water concentrations are relatively high and a competitive adsorption of water cannot be neglected. Furthermore, water typically shows an IUPAC Type V isotherm of which there is a lack of suitable isotherm models available. In such cases, the prediction of mixture equilibria from pure component isotherms is very difficult. Here experiments with gas flow methods are essential for the understanding of the whole sorption process and for the selection of the best adsorbent. In the example described below, the breakthrough curves of water and toluene from nitrogen were measured and evaluated. It can be shown that for toluene a typical S-shaped breakthrough with well-defined temperature peaks was obtained, whereas the shape for the breakthrough and for the temperature profile of water is highly dependent on the water concentration.
Table 1 Measurement conditions for breakthrough experiments.
Sample PretreatmentTemperature ramp:
10 K/min
Final temperature:
150 °C
Dwell time:
5 h
Experimental conditions
Sample mass:
74.5 g
Temperature:
25 °C
Total feed pressure:
1 bar
Water concentration
0.95 Vol. % (30% RH @ 25°C)
(experiment 1):
Water concentration
2.53 Vol. % (80% RH @ 25°C)
(experiment 2):
Toluene concentration
2.00 Vol. %
(experiment 3):
Carrier gas:
Nitrogen
Total volume flow rate:
4000 ml/min (STP)
Method
All measurements were performed on a mixSorb L instrument, equipped with an evaporator option. The sample, about 50 g of an activated carbon, was pretreated in-situ on a mixSorb L at 150°C for 4 h to remove moisture and other pre-adsorbed components. After pretreatment the adsorber was cooled down to a measurement temperature of 25°C. Before starting the breakthrough experiment the adsorber was flushed with pure carrier gas at the desired gas velocity. After reaching constant temperatures the experiment starts by dosing the predefined gas compositions into the adsorber unit. All effluent concentrations were detected using a ThermoStar™ mass spectrometer from Pfeiffer Vacuum. The mass spectrometer was triggered automatically by the mixSorb Manager software package. In Table 1 the inlet concentrations for water and toluene as well as other analysis parameters are given.
Results
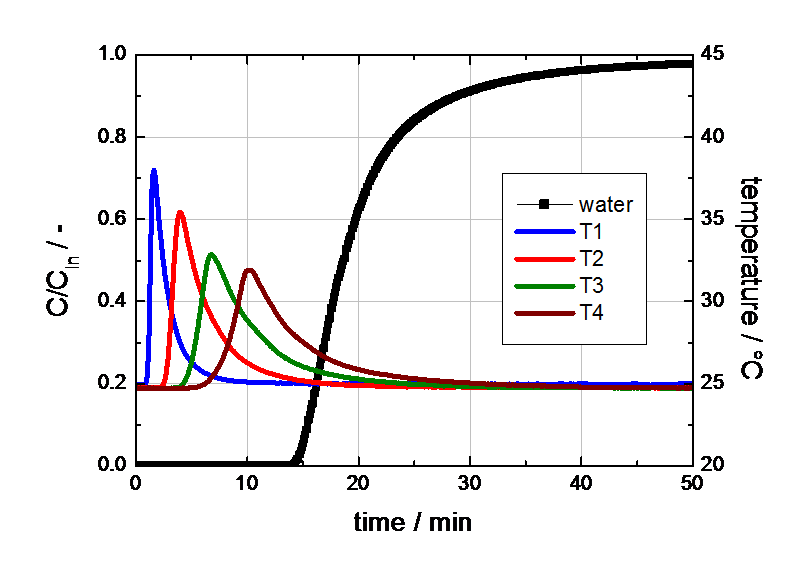
In Figure 1 the breakthrough curve of water at 30% RH at 25°C is shown.
The breakthrough curve of water has a typical S-shape for this low concentration. Contrary to our expectation, the sorption of water on the nonpolar activated carbon induces a nonnegligible increase of the temperature inside the adsorber. This phenomenon indicates a certain sorption affinity for water even at low water concentrations. However, the total sorption capacity of the sample for water is quite low. The results of the breakthrough experiment with water at higher concentration are plotted in Figure 2.
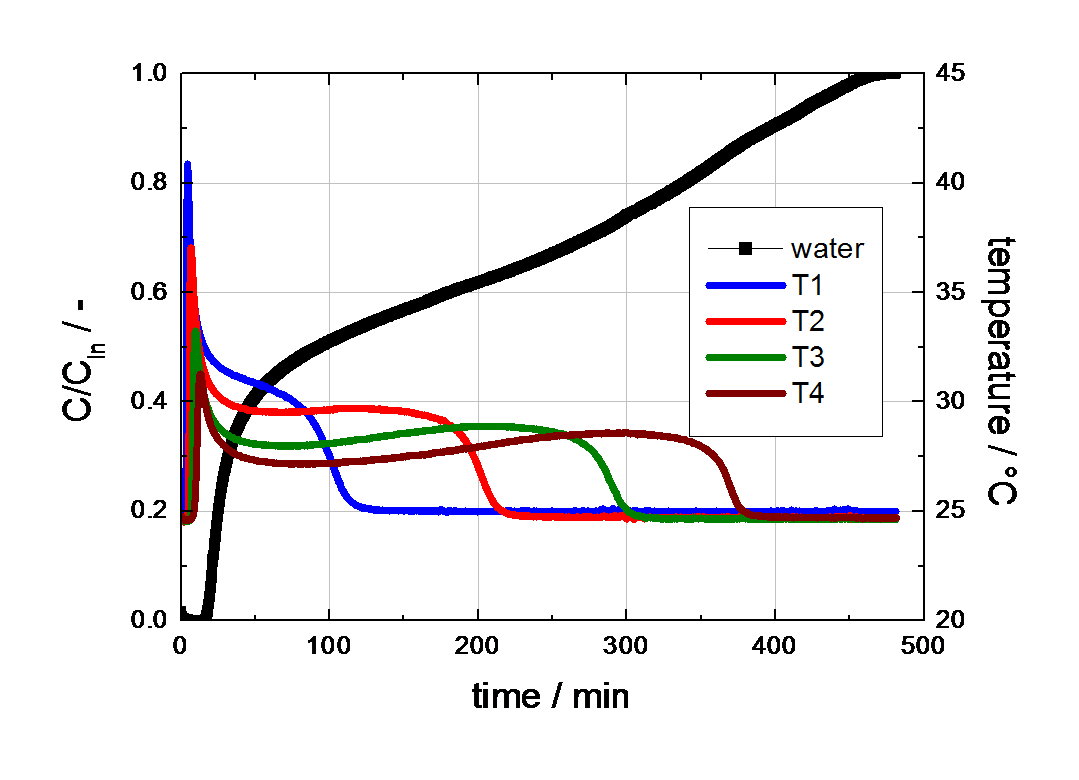
For this example the shape of the breakthrough curve as well as the temperature profiles are completely different from experiment 1 and are in fact quite complex. The temperature profiles initially show sharp temperature peaks caused by adsorption. However, the temperature does not cool to measurement temperature, but remains at about 30°C for a long time. After a while the temperature drops rapidly to 25°C. The mass spectrometer already indicated a continuous increase of the water concentration in the effluent gas at this time and the first increase in concentration was detected after 15 min. This observation can be explained by capillary condensation of water in the pore structure of the activated carbon tested. The temperature profiles are a result of the release of the heat of adsorption first, followed by the release of the heat of condensation.
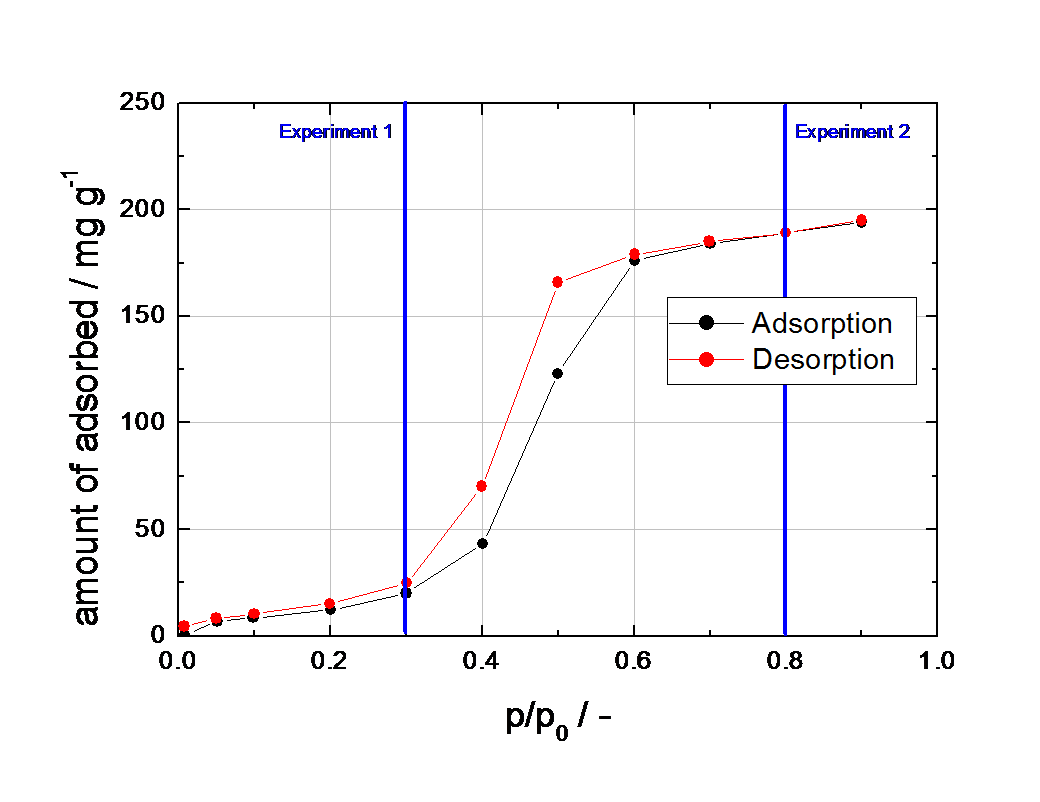
The different shapes of both breakthrough curves reflect the Type V behavior of the water isotherm on activated carbon (see Figure 3).
For a better understanding, the partial pressures of both breakthrough experiments are indicated by the vertical blue lines in Figure 3.
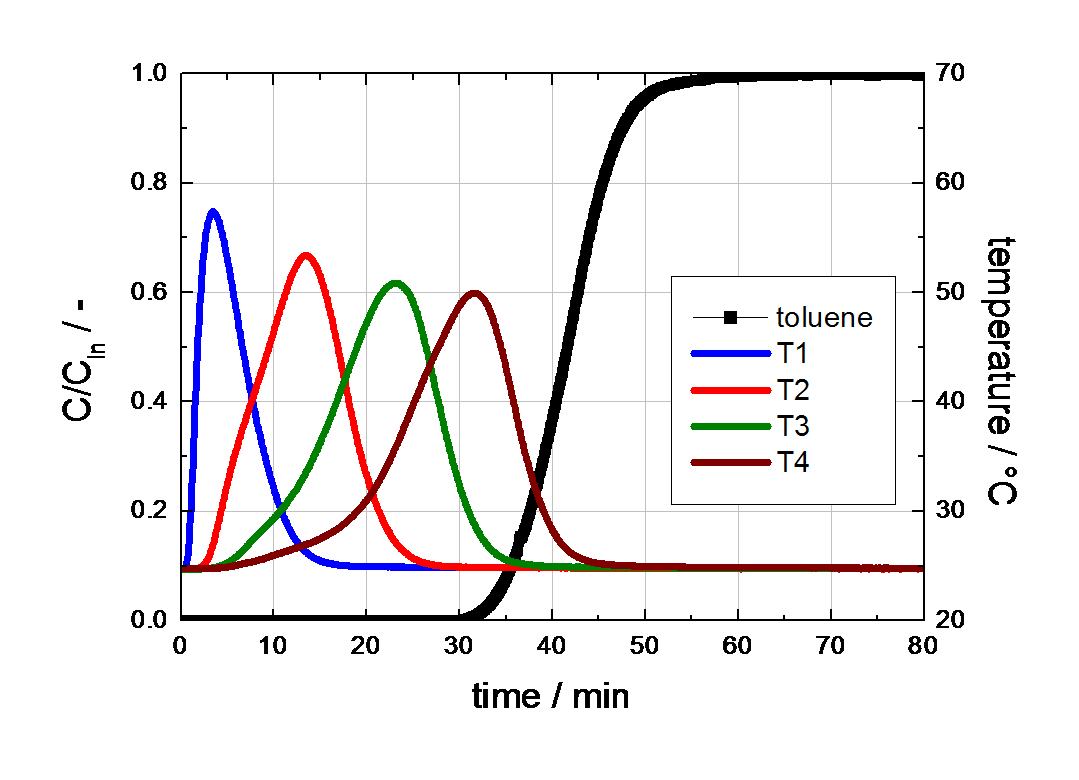
Contrary to the breakthrough curve of water at high concentrations, the breakthrough of toluene shows a typical S-shaped curve with huge temperature peaks (see Figure 4). Figure 4 Breakthrough curve of toluene on activated carbon. The breakthrough of toluene starts about 30 min after exposure to the gas mixture and was already finished before 60 min were reached (see Figure 4).
It is well known, that toluene has a Type I isotherm on activated carbons with a steep initial slope, followed by a well defined saturation plateau. It can be seen that the curvature of isotherms has a tremendous effect on the shape of the breakthrough curves and therefore on the times to reach equilibrium. The large differences in equilibrium times should be taken into account for the proper preconditioning and measuring of samples at high vapor concentrations (e.g., for the preconditioning of activated carbons at high relative humidity).
Figure 1 Breakthrough curve of water on activated carbon (30% RH at 25°C in nitrogen, gas flow 4000 ml (STP) /min).
Figure 2 Breakthrough curve of water on activated carbon (80% RH at 25°C in nitrogen, gas flow 4000 ml (STP) /min).
Figure 3 Isotherm of water on the activated carbon tested at 25°C, measured with a Quantachrome Aquadyne DVS.
Figure 4 Breakthrough curve of toluene on activated carbon.
Summary
Breakthrough curves of water at two different concentrations as well as a breakthrough curve of toluene were successfully measured with a mixSorb L, equipped with an Evaporator Option. It was shown that for low water concentrations the shape of the measured curve has a typical S curvature. Surprisingly, a relatively high increase of temperature can be observed, which indicates adsorption of a significant amount of water on D55/1.5 carbon. This observation is related to the curvature of the water isotherm for low partial pressures. At 80 % relative humidity the shape of the breakthrough curve is completely different due capillary condensation effects. These effects cause characteristic temperature profiles and a long drawn concentration front for water after a short breakthrough time. The time to reach equilibrium is about 10 h, which should be taken into account for the proper preconditioning of nonpolar samples with water vapor. Toluene shows an S-shaped breakthrough curve with strongly pronounced temperature peaks, which are related to the high affinity of this vapor for the surface of this particular activated carbon.


