Breakthrough Curves
General information
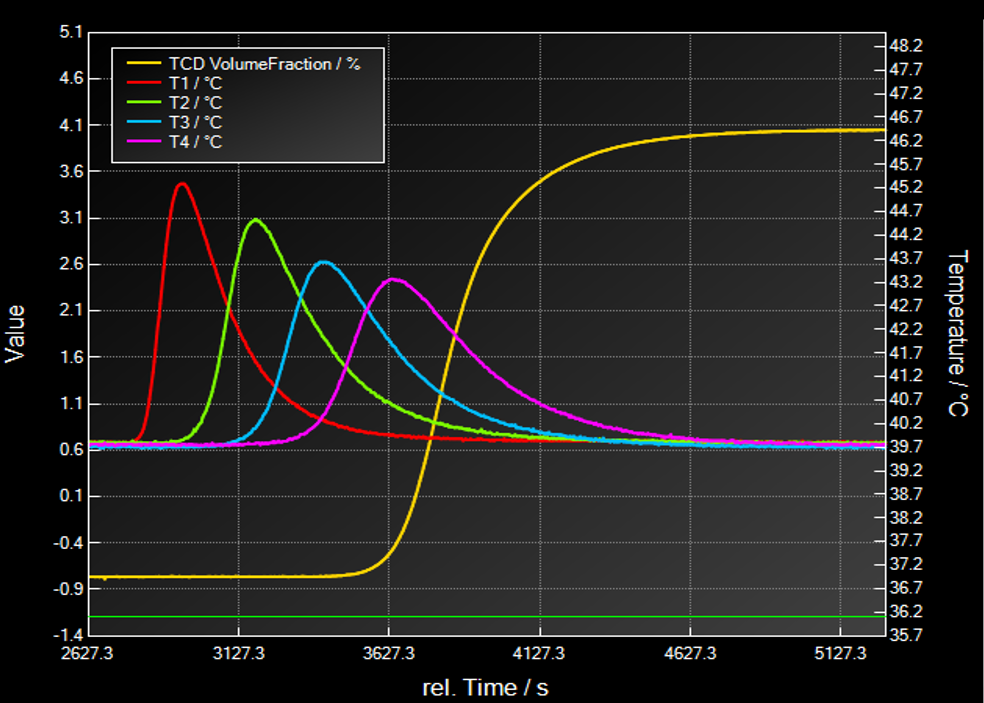
One of the most important results of a dynamic experiment under forced flow conditions on a fixed bed is the so called breakthrough curve. This curve is the time-resolved effluent concentration of the adsorptive under investigation. As already discussed (Dynamic Sorption) a breakthrough curve is an interplay of different kinetic and thermodynamic effects. The sorption capacity, selectivity, release and transfer of heat as well as the sorption rate, inlet concentration and gas velocity play a key role during the dynamic sorption process and influence the position and shape of the breakthrough curve considerably.
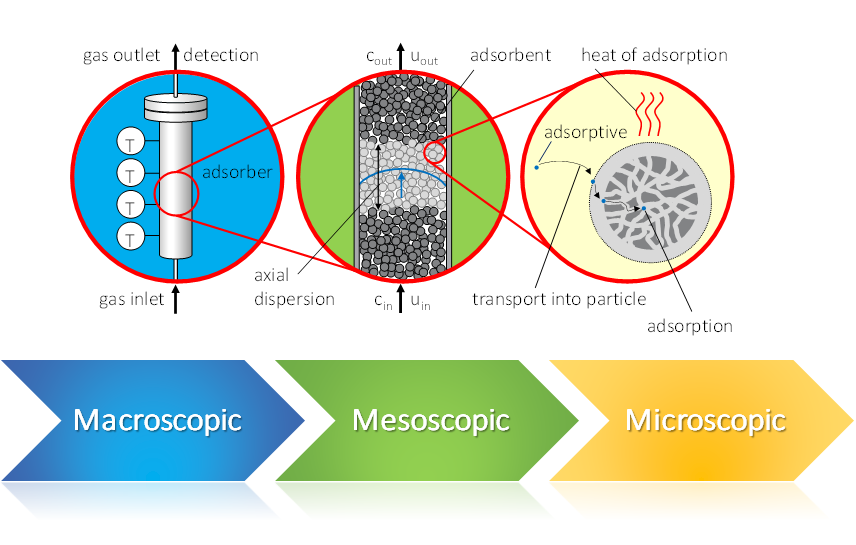
Dynamic gas sorption – a multiscale process
In a dynamic sorption process, you can address several scales. Therefore, the result of such an experiment, the breakthrough curve, contains information about these different scales.
Macroscopic Influences:
- size of adsorber
- shape of adsorber
- gas velocity
Mesoscopic Influences:
- nature of fixed bed
- bed porosity
- shape and size of particles
Microscopic Influences:
- textural properties
- surface chemistry
- accessibility
Breakthrough Curve of one adsorptive
In this section a typical breakthrough experiment will be explained shortly:
- Pressurization with auxiliary gas before measurement to desired pressure
- Dosing of a well-defined gas mixture as a “step function” at tStart=0
- Dosing with constant gas velocity and inlet composition during experiment
- Time resolved observation of effluent concentration
- Time resolved observation of temperature at different locations.
Influence of some parameters on breakthrough curves
A lot of macroscopic, mesoscopic and microscopic parameters influence the shape and position of breakthrough curves. Here the five most important parameter and their impact are summarized.
The sorption capacity has a big impact on the position of the breakthrough curve. By increasing of the sorption capacity the breakthrough curve will be shifted to longer breakthrough times (to the right), because more adsorptive molecules will be held back by the adsorbent. This is not the case if the sorption kinetics on the sample is too slow and a spontaneous breakthrough occurs.
In contrast to the sorption capacity, the sorption kinetics affect the shape of the breakthrough curve. For faster kinetics the breakthrough curve becomes steeper (sharper) and the mass transfer zone will be smaller. A fast mass transfer from the gas phase to the adsorption sites leads to short local equilibrum times and therefore for a smaller enlargement of the concentration front.
In some cases this relationship will be compensated by other phenomena, i.e. the release of heat by adsorption. An increasing sample temperature leads to a flatter, more asymmetric breakthrough curve. This effect can contribute a main part of the expansion of the mass transfer zone.
A fourth parameter is the axial dispersion, which is resonsible for a broadening of the mass transfer zone. This parameter is also responsible for an increasing asymmetric character of the breakthrough curves.
Contrary to this effect, the curvature of the corresponding isotherm can have effects on the shape of breakthrough curves as well. A type 1 isotherm leads to smaller mass transfer zones during adsorption. The desorption curve is broadened in such cases. The opposite can be observed for type 3 and type 5 isotherms.
It is clear that a simple distinction between the individual influences is hard to observe. Here simulations with mass- and energy balances may help for a better understanding of the whole dynamic process.


